Join Trading Competition on Incentivized Testnet.
Top 100 win Protocol Points.
Join Trading Competition on Incentivized Testnet.
Top 100 win Protocol Points.


Crypto traders have spent the better part of a decade hunting alpha. Leverage. Yield farming. Momentum strategies. Basis trades. The playbook is well-worn—and increasingly crowded. But what if the next major source of alpha isn't a new strategy at all, but a new instrument that turns an existing skill—reading market regimes—into outsized, compounding returns?
This is the thesis behind dynamic switching between RiskON and RiskOFF SMART Tokens offered by The Risk Protocol. The idea is deceptively simple: when you expect the market to rally, hold RiskON (which provides ~2× leveraged exposure beyond the option strikes, with no liquidation risk). When you expect a drawdown, rotate into RiskOFF (which caps your maximum loss at 5% per epoch). You can switch between the two at any time—it's a single swap on TRP's Risk Marketplace.
With perfect foresight—always choosing the right token at every epoch boundary—the results are staggering: over five years, a $1 BTC investment becomes $173 through dynamic switching versus $1.13 from buy-and-hold. But nobody calls every move correctly. So we ran a comprehensive backtest across BTC and ETH over multiple timeframes to answer the real question: how often do you actually need to be right to outperform buy-and-hold?
The answer surprised us. You don't need to be a savant. You don't need a proprietary model. The break-even accuracy—the point at which dynamic switching starts beating buy-and-hold—sits at roughly 55%. Barely better than a coin flip. And if you're right two-thirds of the time? A BTC trader with 66% accuracy over 3 years generates a +306% median return—more than double the +132% from buy-and-hold.
These are the result of 10,000 Monte Carlo simulations run across actual historical BTC and ETH price data, using the exact parameters of TRP's SMART Tokens: 30-day epochs, a 5% downside cap on RiskOFF, and ~2× leveraged upside on RiskON beyond the option strikes.
Let's walk through the primitives, the study design, and the findings.
Before we dig into the switching strategy, here's a refresher on the instruments that make it possible.
The Risk Protocol's SMART Tokens (Split Mechanism for Asset Risk-Tokenisation) take an underlying crypto asset—say, BTC or ETH—and split it into two complementary tokens. Deposit 1 BTC, and you mint 1 RiskON BTC + 1 RiskOFF BTC. Each starts at 50% of the underlying's value. Together, they always equal the whole. But their risk profiles are radically different.
RiskOFF is the conservative half. It tracks the underlying within a bounded range: its downside is capped at 5% per epoch under normal market conditions. In exchange, it gives up extreme upside—gains beyond the cap flow to RiskON. Think of it as a "stabler coin"—not pegged to a dollar, but dramatically less volatile than the underlying.
RiskON is the aggressive half. It absorbs the volatility that RiskOFF sheds. Within the option strikes (−5% to ~8%), both RiskON and RiskOFF track the underlying one-for-one. But when the market rallies past RiskOFF's cap, RiskON captures all of the additional upside—earning both its own share and the share RiskOFF forfeits, delivering ~2× leverage on the move beyond the strikes. Conversely, when the market drops below RiskOFF's floor, RiskON absorbs all the additional downside. The key difference from traditional leverage: there are no margin calls, liquidations, or funding rates. RiskON can lose value (even approach zero in an extreme epoch), but your position never goes negative.
Every 30 days, the system rebalances. A new epoch begins, the option strikes reset, and both tokens restart from equal value. This creates a perpetual, rolling exposure—you never need to manage expiries or roll positions manually. Critically, trading is continuous: you can swap between RiskON and RiskOFF at any point during an epoch, not just at boundaries. The epoch defines when rebalancing occurs; it doesn't constrain when you trade.
The payoff asymmetry is what makes dynamic switching so powerful. In bullish markets, RiskON amplifies your gains through ~2× leveraged upside. In bearish markets, RiskOFF cushions your downside with a hard 5% loss cap. Rallies are amplified. Drawdowns are contained.
Our goal was to answer a precise question: given a trader who switches between RiskON and RiskOFF based on a directional forecast, how does their cumulative return vary with the accuracy of that forecast?
We used historical daily price data for BTC and ETH, segmented into 30-day epochs—the same duration that SMART Tokens use for their rebalancing cycle. This isn't an arbitrary time window; it mirrors the exact epoch structure of RiskON and RiskOFF as they operate on-chain. For each epoch, we computed the actual return of the underlying asset and, from that, the corresponding return of RiskON and RiskOFF using TRP's SMART Token payoff mechanics.
We then simulated a trader who, at the start of each epoch, makes a binary call—"up" or "down"—and picks the corresponding token. If they predict "up," they hold RiskON for that epoch (to capture leveraged upside). If they predict "down," they hold RiskOFF (to limit their loss to a maximum of 5%). Their cumulative wealth is then tracked across the full period.
The "accuracy" parameter ranges from 0.50 (coin flip—zero skill) to 1.00 (perfect foresight—calling every epoch correctly). At 0.66 accuracy, the trader gets roughly 8 out of 12 monthly calls right per year. The probability of a correct prediction at each epoch is independent and equals the accuracy parameter.
Because the order of correct and incorrect calls matters hugely (getting it wrong during a −40% crash is very different from getting it wrong during a −2% dip), we don't just compute one path per accuracy level. We ran 10,000 randomised paths at each accuracy level—some where the trader happens to get the big crashes right, some where they don't—and report the full distribution: the mean return, the median return, and the 5th/95th percentile bounds (the 90% confidence interval). This captures not just the expected outcome, but the range of plausible luck.
The study runs across four separate lookback windows, all ending at April 1, 2026:
Each window is an independent simulation. The different timeframes test whether the strategy's edge holds across different market environments rather than being cherry-picked from one favorable period.
Let's start with the extremes.
The "Optimal Switching" column below represents the theoretical ceiling—the return from a perfect epoch-level switching path across each timeframe. Over the last five years, always being in the right token in every epoch would have turned every $1 into roughly $173. Buy-and-hold BTC over the same period returned +13% ($1 → $1.13). That's an outperformance factor of $173 ÷ $1.13 = 153×—meaning perfect switching produced 153 times more wealth than simply holding BTC. For ETH, the gap is even more dramatic: perfect epoch-level switching returned +38,440% ($1 → ~$385), while ETH buy-and-hold was actually negative over this period ($1 → $0.81)—an outperformance factor of $385 ÷ $0.81 = 479×—479 times more wealth than buy-and-hold.
Of course, nobody calls every move correctly. The real question is: how wrong can you be and still win?
The break-even accuracy answers this directly. For BTC, the threshold ranges from 55% to 56% across all timeframes. For ETH, it's 55% to 70%. Why does ETH require higher accuracy? Because ETH is more volatile than BTC. A wrong call on ETH produces a larger downside move than a wrong call on BTC, and because returns compound geometrically, those larger losses are disproportionately devastating—a 50% loss requires a 100% gain to get back to zero. So making wrong predictions on ETH destroys value faster than making wrong predictions on BTC, which is why the break-even threshold climbs higher on ETH's longer timeframes. But in the most common timeframes that active traders operate on (1–3 years), the bar sits around 55%—a remarkably low hurdle.
The linear scale above makes one thing immediately clear: the returns from perfect switching are so large that they dwarf buy-and-hold into invisibility. To compare all four timeframes on equal footing, the log-scale version below makes the shorter-horizon bars readable while preserving the full range.
The headline numbers show the ceiling. But the real insight lives in the shape of the return curve as accuracy increases from 50% to 100%.
At 50% accuracy—pure randomness—the results confirm the model is behaving correctly. For BTC over 3 years, a coin-flip switcher generates a median return of ~86%, below buy-and-hold at ~132%. No alpha is being created; you're just adding noise. This is exactly what you'd expect.
Over longer timeframes, the picture gets worse. At 50% accuracy over 5 years, BTC's median return is −39.50%—meaning the typical random-switching path loses a substantial portion of capital. The mean is pulled up by a few lucky paths that happen to get the big moves right, but the median reveals what most traders would actually experience. Random switching is worse than buy-and-hold for the typical trader. The edge only appears when accuracy meaningfully exceeds 50%.
Watch what happens as accuracy rises. The curve is convex—returns don't scale linearly with skill; they accelerate. A BTC trader with 66% accuracy over 3 years generates a +306% median return versus +132% buy-and-hold—more than double. Even at the 5th percentile (an unlucky sequence of calls), the return is +65%—still positive, still respectable.
For ETH at 66% over 3 years: +148% median return vs. +14% buy-and-hold—over 10× the return from modest forecasting skill applied through SMART Tokens. Even at the 5th percentile, the return is −34% (the only scenario where you meaningfully underperform).
The gain from 50% → 66% accuracy on BTC (3Y) is roughly 220 percentage points of median return. The gain from 66% → 75% is another 226 points—from just 9 additional percentage points of accuracy. This convexity is the signature feature of the strategy.
At 75% accuracy, BTC over 3 years delivers a +532% median return, with the 5th percentile at +165%—well above buy-and-hold even in an unlucky scenario. For ETH over 5 years, a 75%-accurate switcher produces a +1,098% median return—turning $1 into roughly $12, compared to $0.81 from holding spot ETH over the same period (ETH was actually down over 5 years).
The chart above plots forecast accuracy on the X-axis and cumulative return on the Y-axis. The solid line is the median return at each accuracy level—the outcome for the typical path, not the average (which can be skewed by outliers). The shaded band is the 90% confidence interval (5th to 95th percentile), and the dashed line is buy-and-hold.
The key visual takeaway: the median line crosses above buy-and-hold at around 55% accuracy, then curves steeply upward. Small improvements in accuracy produce increasingly large improvements in returns.
The confidence band also widens over longer timeframes in absolute percentage terms. The reason: over 12 epochs, a lucky run and an unlucky run only have 12 opportunities to diverge from each other. Over 75+ epochs (All Time), they have 75+ intervals to compound those divergences. Because returns multiply rather than add, early differences compound exponentially—hitting a few consecutive winners versus a few consecutive losers produces drastically different final portfolios. (Note: this may look counter-intuitive on the charts because the y-axis scales with the longer-horizon numbers, creating an optical illusion that the band is narrower. In percentage terms, it isn't.) Even so, at 66%+ accuracy, even the bottom of the band generally sits above or near buy-and-hold—indicating that outcomes become reliably positive rather than lottery-dependent.
The backtest results paint a compelling picture, but what does this look like in practice?
Mechanically, dynamic switching is trivial. RiskON and RiskOFF are standard ERC-20 tokens. Switching between them is a single swap on TRP's Risk Marketplace - no need to unwind positions, manage margin, or deal with expiry rollovers. You can swap at any point: at the start of an epoch, mid-epoch, or in response to a sudden regime shift. The 30-day epoch defines when rebalancing occurs; it doesn't constrain when or how often you trade.
The more interesting question is: what signal frameworks can drive the switching decision?
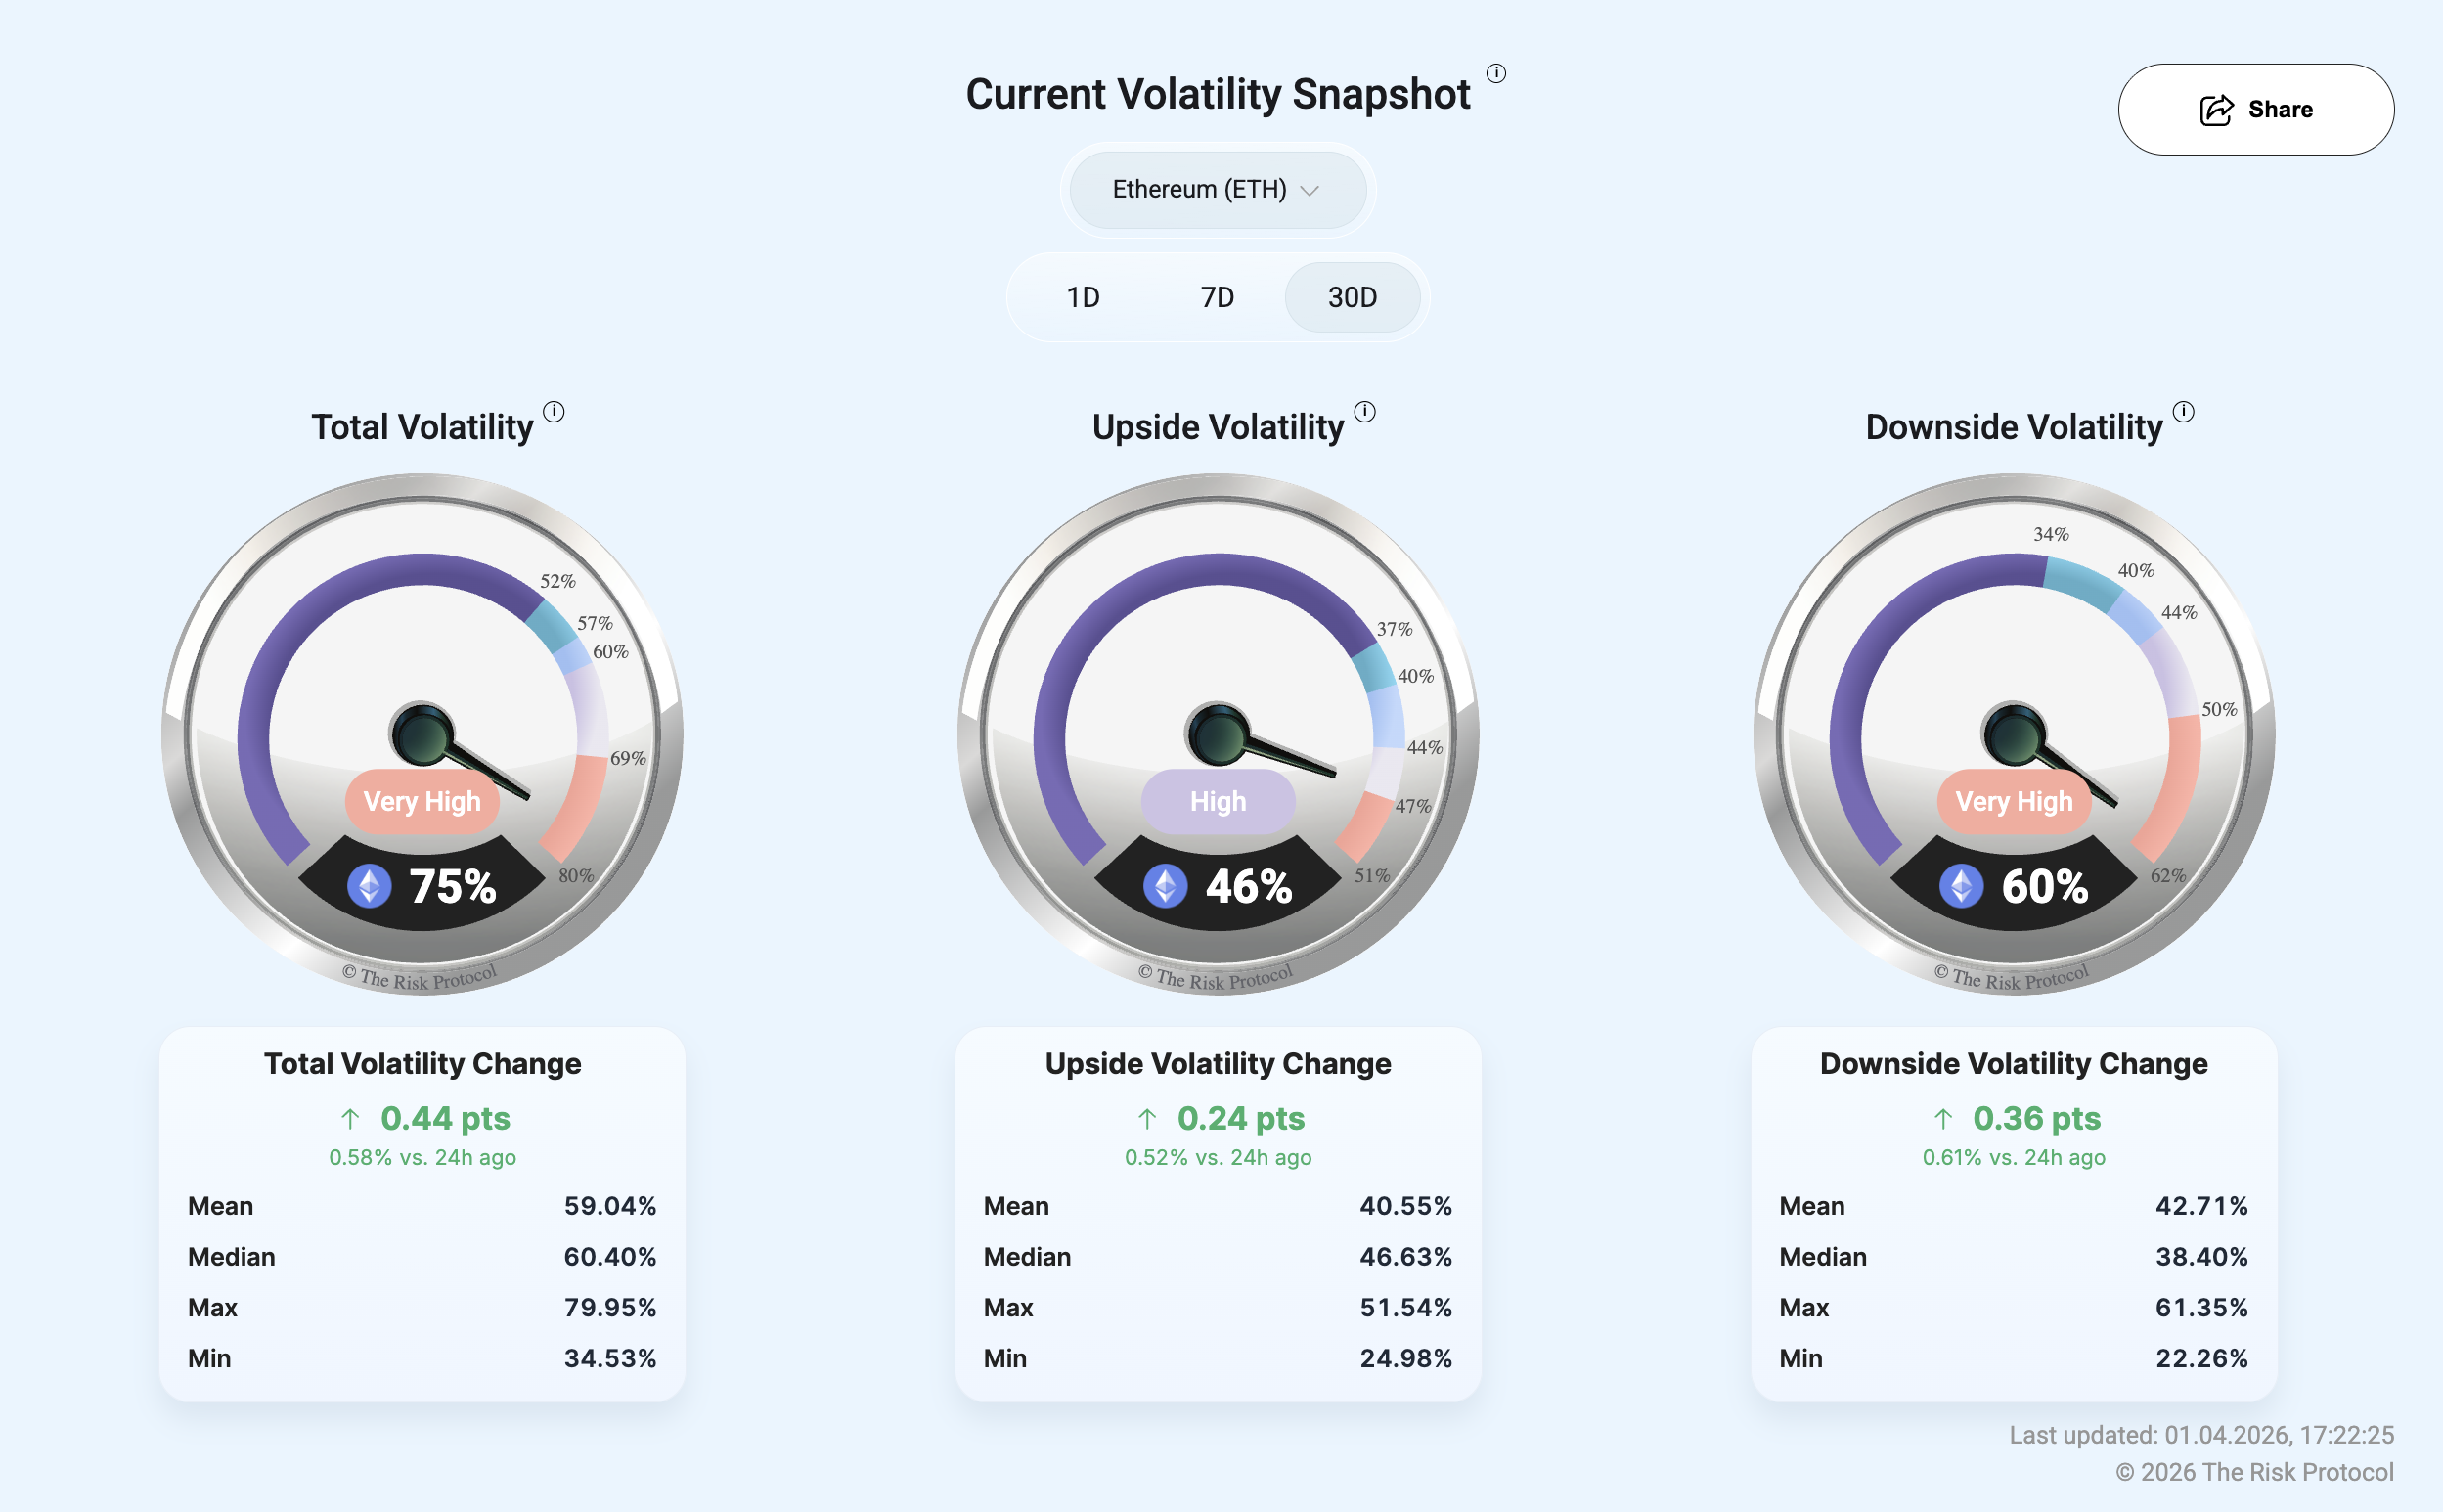
This is where The Risk Protocol's infrastructure layer becomes relevant. We're not building isolated trading instruments—we're building the full stack. TRP's Risk Dashboards provide a real-time, continuously updated view of how risk is building, shifting, and being priced across a universe of crypto assets. The dashboards surface signals like historic and forecast volatility, upside vs. downside risk asymmetry, sector-level risk concentration, and volatility regime indicators—precisely the kind of inputs that inform a switching strategy. A trader looking for a directional signal doesn't need to build their own analytics pipeline from scratch. They can read the risk regime directly from TRP's dashboards and express that view by swapping between RiskON and RiskOFF.
This is a deliberate architectural choice. We're not building one-off products—we're building the infrastructure layer for RiskFi. The instruments (SMART Tokens), the exchange (Risk Marketplace), and the intelligence (Risk Dashboards) are designed to work together as a cohesive system. The dashboards generate signals. The tokens express those signals as positions. The marketplace provides the liquidity to move between them. Each layer reinforces the others.
Beyond TRP's own dashboards, several external signal frameworks are natural candidates: momentum crossover strategies (whether the 30-day trend is up or down), on-chain flow data (exchange inflows/outflows, whale accumulation, stablecoin mint rates), and funding rate regimes on perps (signaling when the market is over-levered in one direction). None of these individually guarantee 66% accuracy. But in combination—and especially applied to a 30-day horizon that smooths out daily noise—directional accuracy in that range is achievable for disciplined traders.
The comparison crystallises what makes dynamic switching unique. It's the only strategy that combines leveraged upside while giving you an ability to hard-cap downside all with trivial execution complexity. Leveraged perps offer upside but expose you to liquidation. Options offer protection but require active management of greeks, expiries, and premium decay. Buy-and-hold requires no effort but gives you no edge. SMART Token switching sits at the intersection: leveraged, protected, and simple.
Intellectual honesty demands we flag what this study doesn't tell you.
It doesn't tell you how to achieve any particular accuracy. The study parameterises accuracy but doesn't prescribe a signal framework. Getting to 66% accuracy on monthly directional calls is plausible—but not guaranteed.
We report median returns, not mean, throughout this analysis. The median represents the typical path—what most traders would actually experience. The mean can be significantly higher, pulled up by a few lucky paths that happen to nail the big moves. For example, over 3 years at 50% accuracy, BTC's mean is +117% but the median is just +86%. At 66% accuracy the gap widens further (BTC 3Y mean +356% vs. median +306%). At lower skill levels, mean returns would substantially overstate what a typical path looks like.
The epoch-boundary model is a simplification. Since traders can switch at any point mid-epoch, the real opportunity set could be larger. But it could also be smaller if a trader switches at poor times intra-epoch. The model provides a conservative, well-defined framework.
Returns are gross of fees. Real-world returns would be modestly lower after swap fees and potential slippage.
For those interested in the mechanics behind these numbers, here is a step-by-step breakdown of the simulation methodology.
Step 1: Determining monthly winners and losers. For every single epoch in the dataset, the simulation calculates the return of both the RiskON strategy and the RiskOFF strategy. The higher return is recorded as the "winner" and the lower as the "loser." This establishes the upper and lower bounds: perfect foresight (100% accuracy) always captures the winner return; zero skill always gets the loser.
Step 2: Monte Carlo simulation. The simulation runs 10,000 paths per accuracy level. For example, at 70% accuracy, it flips a weighted coin for each epoch: 70% of the time it grants the winner return, 30% of the time the loser return. It then compounds these returns across the full period. Running 10,000 random sequences accounts for the fact that the sequence of returns matters—being right 70% of the time in a bull market yields vastly different results than being right 70% of the time in a bear market.
Step 3: Regime testing across time windows. The simulation is run independently across four timeframes (12 months, 3 years, 5 years, and all time). Financial markets experience different regimes—bull markets, crypto winters, sideways chop. A strategy that works well over the last 12 months might be disastrous over 5 years. Testing multiple timeframes demonstrates the robustness of the approach.
Step 4: Finding the break-even accuracy. The simulation iterates through accuracies from 50% to 100% to find the exact percentage where the median Monte Carlo return exceeds buy-and-hold. Using the median (not the mean) is deliberate—it ensures the typical path outperforms, not just the average, which can be skewed by a handful of exceptional outcomes. This is the ultimate "go/no-go" metric: if the break-even is 55%, a basic trend-following model might succeed; if it were 85%, the strategy would be mathematically unviable.
For years, DeFi has treated risk as something to avoid, insure against, or hedge away. What the dynamic switching backtest reveals is that risk, properly harnessed, is itself a source of alpha. By splitting an asset into two complementary risk instruments and strategically toggling between them, traders can generate convex returns that far exceed buy-and-hold—without ever facing liquidation, margin calls, or catastrophic single-period losses.
The data is clear: the bar to outperform is low (~55% accuracy), the upside scales non-linearly with skill, and the downside can be hard-capped at 5% with skill. This is a new primitive—not just a new strategy, but a new instrument class that creates alpha opportunities that simply didn't exist before.
As The Risk Protocol approaches incentivised testnet followed by mainnet, the Risk Layer is starting to come online: the instruments to express risk views (first set of SMART Tokens: RiskON/RiskOFF), the marketplace to trade them (Risk Marketplace), and the intelligence layer to inform decisions (Risk Dashboards). The alpha is waiting to be harvested.
Disclaimer: This article presents the results of a historical backtest and is for informational purposes only. Past performance is not indicative of future results. The study does not account for transaction costs, slippage, or market impact. Dynamic switching involves risk, and users should assess their own risk tolerance before engaging with any trading strategy. SMART Tokens are not yet available on mainnet. Nothing in this article constitutes financial advice.


